Making our controllers more observable is something we have been working on for a while. The first step in the journey was to introduce more descriptive and consistent status and events across all Kratix-owned resources (for example, check the Promise status and events). Together with additional printer columns for the kubectl get command, this represented a great improvement to the user experience of operating a platform that uses Kratix.
side note: I often say destination statuses were the best feature we ever implemented in Kratix. Time has been proving me right:
The next problem we wanted to tackle was logs. Whenever an error occurred, our customers would need to go through a painful journey sifting through hundreds of lines of logs to attempt to find the one line that contained the right error. Kratix output a range of logs at different levels, all unstructured. We often caught ourselves on customer support calls just to point out to them that the error is right there, line 5675 of the logs. We needed to do better.
So back in June 2025 the team at Syntasso got together to explore how we could make discovering what went wrong when their platform is not behaving the way they expected easier. The results of that session were a series of guidelines and best practices for logging that we should follow when building out controllers. In this blog post, we will go through those guidelines, how we implemented them, and the results we have seen so far.
Whenever a Kubernetes resource is created, updated, or deleted, a controller watching that resource will be notified, and will attempt to reconcile the declared, desired state with the actual state for that resource. For example, when you increase the replicas of a ReplicaSet from 1 to 3, the ReplicaSet controller will create 2 new Pods, so that the desired state (3 pods) matches the actual state in the cluster. This is the Kubernetes reconciliation loop.
A single action on a resource does not mean a single reconciliation loop. The controller itself may change the resource being reconciled, or it may spin up children resources, or may need to requeue a reconciliation while another resource is being provisioned. What matters is that, eventually, the actual state will match the desired state, regardless of how many reconciliation loops are required.
But that poses a challenge for logging in the context of Kubernetes controllers: due to the nature of the reconciliation loops, a single log line may appear multiple times every time a change is made to the system. If you don't think about your logging strategy, you may flood your customer with too many logs for anything useful to stand out. And that was exactly what we were doing with Kratix.
To define our logging strategy, we started by asking ourselves: who are the target personas for the logs? What change in behaviour do we want to see in each of them?
We identified four main customers for the Kratix logs:
The Platform Operator: responsible for the platform as a whole, this persona is the one managing the platform. She is the one called when something is not working as expected, or the one that is notified when alerts are triggered. She is responsible for configuring Kratix, State Stores, Destinations, and other platform-wide settings.
The Promise Writer: the persona writing Promises and contributing services to the platform. She is responsible for the Promises she writes, and is called when one of her Promises is not delivering the promised service.
The Application Developer: the users of the platform, interacting directly with the Promises to request resources. She is responsible for building the applications that will be deployed and use the services on the platform.
The Kratix developer: that's us, the developers building Kratix, and anyone in the community who is interested in contributing to it. This persona needs to understand the internals of Kratix, and to be able to effectively debug issues while building new features.
Each persona looks at the logs to solve a different problem:
The Platform Operator is, as the name suggests, operating the platform. She needs to know the platform is up, running, and operating as expected, the resources are properly configured, and that the platform is free of non-recoverable errors. She wants to know when operations start and complete, and when platform resources change statuses.
The Platform Engineer wants clear errors and debuggable logs while building and operating their Promises on the Platform. She is interested in the pipeline outputs, reconciliation errors for her Promises, validation of CRDs and other Promise-related documents.
The Kratix developer needs logs that help her debug almost step-by-step actions the Kratix code is executing. Ideally she will have enough data to find the exact line of code where something should have happened but hasn't. This enables effective debugging and improves development velocity.
And what about the application developer? In an ideal world, she doesn't care about Kratix logs at all. The information she needs is encapsulated and exposed as higher-level abstractions, like resource statuses. If she has to jump into the Kratix Controller logs to understand what's going wrong with her Promise request, there's likely a missing abstraction somewhere.
From the personas and their needs, it's clear we needed to introduce a way to increase or decrease the level of detail our controllers would emit, to satisfy each persona's needs without being more verbose than they needed.
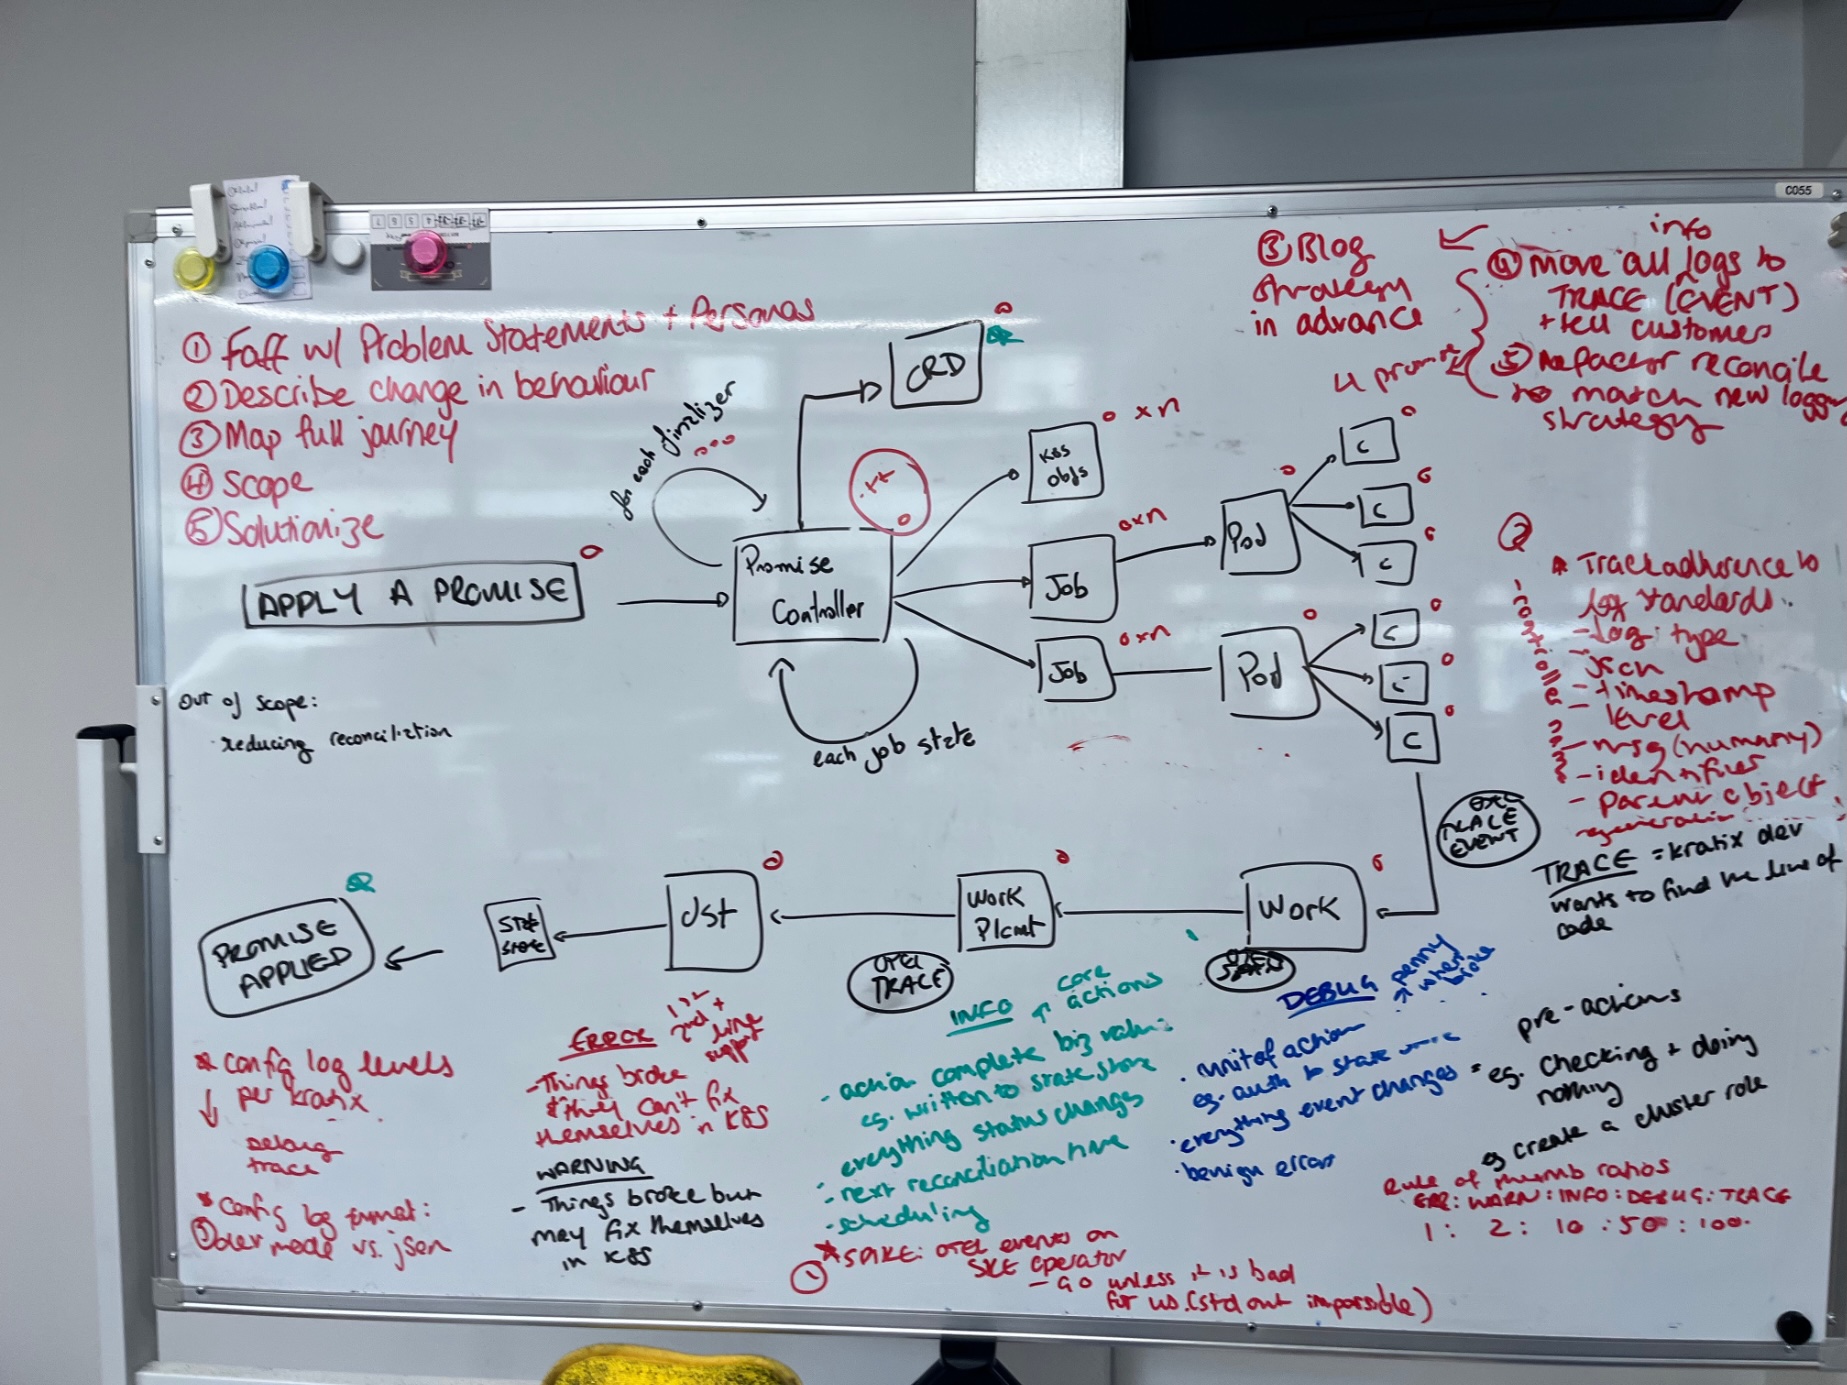
Log levels are very common in the industry, and terms like DEBUG, WARN and INFO are familiar and widely recognised. However, there's no true standard for what each level means, and different projects associate different meanings with each level. The OpenTelemetry Severity Model provides a good starting point for what each level could represent. Based on it, we mapped out what the levels would mean for someone using Kratix. To give us an idea, we drew a diagram of what happens when someone installs a Promise on the Platform:
(I swear it made sense at the time)
The result was the log levels we now use in Kratix, as described in the table below:
Level / Severity
Persona
Usage Guidelines
Examples
ERROR
All
Something is permanently broken and may require human intervention
Invalid YAMLs
Can't talk to Git server
Invalid Bucket endpoints
WARNING
All
Something is temporarily broken but may fix itself within the Reconciliation loop
Promise is unavailable
State Store secret not found
No available destinations
INFO
Platform Operator
Heartbeat of the platform
Reconciliation-level logs
Business relevant actions completed
A resource status has changed
Reconciliation started and ended
Scheduling work to a destination
Next reconciliation time
DEBUG
Platform Operator / Platform Engineer
Function-level logs
Transitional errors
Code actions completed
Applying the Promise API
Running a Pipeline for a Resource
Creating a WorkPlacement
TRACE
Kratix Developer
Pre and Post actions
Used to identify a particular line/area of code
Creating auxiliary resources
Verifying if there's a pipeline in progress
Calculating Promise Spec hash
As you can see, the log levels are designed to be used by different personas, and to be used at different times. The Platform Operator is interested in the heartbeat of the platform, the Reconciliation-level logs, and the business relevant actions completed. The Platform Engineer is interested in the function-level logs, the transitional errors, and the code actions completed. The Kratix developer is interested in pre- and post-actions, and in logs that help identify a particular line or area of code.
Log levels can be configured today via the Kratix Config. We have defaulted the log level to info, but you can configure it to debug or trace to get more detailed logs. Give it a try today and let us know what you think!
Together with Cat Morris, we gave a talk at KubeCon NA 2025 about how we are thinking about observability in Kratix. We cover logs, as well as other aspects of observability like metrics and traces. You can watch the talk below:
What are your thoughts on log levels? What would you like to see? Let us know in the comments below, or reach us on our Slack!